The Steam Room

design. data. form.

On Documenting the Design of Software Systems

I have been working with Graphviz in general and Dot in particular to document the design of the software I work with. It has  proved to be a versatile tool for documenting software design. In my conversations with coworkers within my organization and software developer friends outside it, I discovered that Graphviz, though hugely popular in some circles, is not as widely used as it can be by software developers. Hence, I decided to evangelize the use of these tools for software development. I did a small training session at my workplace for colleagues.  To help evangelize it outside of my workplace, I have published an article on the many ways in which Dot and Graphviz can be used. You can read it at https://www.linkedin.com/pulse/communicating-design-using-pictures-without-having-draw-balaraman/

If you are already a user of Dot and Graphviz, I would love to hear your ideas on how these tools help make communicating design easy and efficient.

Questionnaire for requesting feedback at your workplace – based on the book “What got you here won’t get you there” by Marshall Goldsmith

In 2017, a dear friend of mine recommended the book “What got you here won’t get you there.” by Marshall Goldsmith. He told me that it was one of the most influential books in his life.  After having read and reread the book, I am grateful to my friend for his recommendation. The author lists and elaborates on 21 workplace habits that people accumulate over a period of time. These habits not only affect our growth but more importantly annoy and create a difficult workplace environment for our colleagues.  Though the title of the book may indicate that the book is tailored for leaders and the workplace, I find that attention to the habits can help in our personal lives as well.  The book is not necessarily for successful people to become even more successful as the title indicates. It is important at any stage of our lives. I would recommend every college kid to read it.

Here is a 40-minute talk by the author himself – https://www.youtube.com/watch?v=xY7UJVYM9n0 . It’s entertaining and illuminating in equal parts.

On my first reading of the book, I was convinced I was guilty of some of the habits listed by the author. The next logical step was to ask the people I work with for their feedback (about me) on each of the 21 habits listed in the book. I captured all the habits in an Excel sheet as a questionnaire. I also added an extra question to the list that I thought would be useful to get an answer to. The questionnaire had one question for each habit. Each question included a short write-up on what the habit meant.  I emailed the questionnaire to my colleagues and managers with a short write up on what I was trying to achieve. The feedback I received was the best feedback I had received until that point in my career.  One manager in my group replied back saying that the questionnaire took him on a journey of self-introspection. I am truly grateful to my colleagues who invested their time in providing me feedback in this form.

If you would like to use the questionnaire, you can download it from here – https://github.com/kay-m/what-got-you-here-wont-get-you-there

Nearly all of the content in the questionnaire is from the book. The book is available on Amazon – https://www.amazon.com/What-Got-Here-Wont-There/dp/1401301304/

Hands-On with PostgreSQL Internals

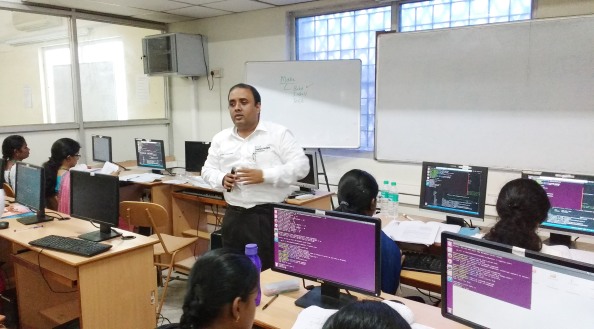
As part of the university outreach efforts at Hewlett Packard Enterprise, a team of engineers from the SQL/MX database group within the HPE NonStop Servers division  conducted a one credit course on database internals at PSG college, Coimbatore in August 2016. The course was attended by about 45 students from the computer science department.

HPE NonStop servers ship with a proprietary operating system and associated software development stacks.  These servers (formerly Tandem computers) were built for transaction processing and hence they have always shipped with a database management system. The current avatar of the RDBMS that ships with NonStop servers is called NonStop SQL/MX.  Being members of a group that owns a database management system, our natural choice for a one credit course was on introducing the students to the idea that work on relational database engines is seeing a revival thanks to the possibilities exposed by the new problems that are yet to be solved for the era of big data.

Most undergraduate programs in the computer science stream offer only an introductory course on relational databases that cover data modeling, query languages and concepts of transaction processing.  The challenges of building a robust query compiler, the algorithms used for relational algebra operator evaluation and the strategies for query execution are generally part of a master’s level course on database internals. There are very few groups in the academia in India that focus on database internals. The best and most recognized groups in India are the database systems groups at IISc, Bangalore and IIT, Bombay.

Given that most of the course attendees would not have the necessary background on database internals, our focus was on the following:

  1. Introduce one aspect of database internals that can be grasped in a few short hours. We selected query cost estimation using histograms.
  2. Get the participants familiar with the source code of one open source database management system. The idea was that once they are comfortable working with the source code, they would have the necessary skills to get into the details of the database system implementation if and when they wanted to extend the database capabilities for a future project.  In doing this, we had the following sub goals:
    1. Walk the participants through the steps of compiling and installing open source software.
    2. Introduce the basic steps in understanding execution flow via the debugger.
    3. Use built in regression tests that come packaged with open source software.
    4. Extending the database engine’s capabilities.

A colleague of mine handled query cost estimation and I volunteered for the second part.  I started with little knowledge of PostgreSQL internals and was delightfully surprised with the instructive content available online for anyone wishing to understand PostgreSQL internals. I also had a serendipitous meeting with a friend of mine who used to work at Microsoft (https://www.linkedin.com/in/cvishnuprasad/).  He convinced me to use a new tool from Microsoft called Microsoft Code. Code is a cross platform IDE that works beautifully on Linux.  I found it much better than Eclipse for the task I was working on.   I prepared a virtual machine with everything necessary for the participants to get started with a collection of PostgreSQL exercises I had prepared.  At the end of the six exercises, the participants were expected to be comfortable with the following:

  1. Building, installing and starting PostgreSQL database server on a Linux system.
  2. Running built-in tests that validate fundamental features of PostgreSQL.
  3. Walking though the execution of simple SQL statements via the debugger.
  4. Inspecting the output of the stages of the SQL compilation via the debugger.
  5. Modifying an existing built in function of PostgreSQL and rebuilding PostgreSQL after the change.
  6. Adding your own custom function as a built-in function of PostgreSQL

One the virtual machine was made ready, the good folks at the CSE department at PSG college downloaded the virtual machine image from my cloud storage and had it deployed on all the computers to be used for the hands-on session.   A previous visit from my team mate helped iron out the system requirements for the virtual machine.

at-psg

The hands-on session with PostgreSQL was well received and subsequently, the department requested for project ideas on the same topic that the participants could work on as part of the same one credit course. I assembled a set of projects that were doable with the knowledge gained in the hands-on session. The projects were on integrating ideas from other domains like encryption, text analytics etc into the database engine rather than in extending the query compiler or other core database engine areas. The idea was to give the participants the confidence that they can implement an idea/algorithm and get it integrated with a popular database engine if they needed it.  Extending the core of the database engine at the student level is more suited to a master’s level course on database internals.

If you would like to try the exercises and the projects yourself, you can download the Ubuntu Linux based virtual machine (VMWare based) and the course material (two pdf documents – one with the exercises and the other with the projects) from the following Microsoft OneDrive location.  The folder also contains some relevant papers that we had distributed to the course participants. The compressed virtual machine image available for download is 4GB in size.  The virtual machine is ready to use for the exercises and the projects.  The instructions to login and get started are in the document containing the hands-on labs.

Click here to open Microsoft OneDrive folder containing virtual machine and the handouts.

Please drop in your suggestions as comments to this post.

Talk on foundations of data visualization

I had the opportunity to share my interest in data visualization in the form of a talk at the department of Mathematics and Computer Science at Sri Sathya Sai Institute of Higher Learning in June 2015.  The talk was received well and there was a repeat of the same talk at the Bangalore campus of the University in January 2016 and a third time at the Muddanehalli campus of the University in 2019.  I am currently creating a new version of the talk for corporate leaders.

The talk at the Prashanthinilayam campus was recorded and uploaded to youtube.

Convert your Raspberry Pi into an audiophile music player using volumio

There are many cool uses for the Raspberry Pi. I was on the verge of buying an iPod Nano (to replace my broken ipod) when a friend asked my opinion about the Raspberry Pi – something I had not paid attention to until then. After the usual frenzy of reading reams of online “literature” about the device, I decided to buy one along with my friend and dropped my plan to buy the iPod. My intent was to use the Pi as a music player within my home.  We ended up buying the recommended kit- the model B Pi, an Edimax USB Wi-Fi card, a powered USB hub and a case for the Pi.   After the customary initial enthusiasm, the device was confined to my cupboard because I found that the plain vanilla Raspbian OS for the Pi was too much of a hassle to use as a media player.  I could not install XBMC because it expects you to have a HDMI monitor connected on first boot – something that I do not have.

Things have changed a lot since I discovered volumio. This was what I bought the Pi for! The fantastic folks who built this have documented only one purpose for this device – to play all your music with the highest possible quality. I like the sound of that!

This article describes the process to configure your Raspberry Pi to run volumio.  I am assuming that you have a basic knowledge of the capabilities of the device if you are still reading this line. The article does not talk about the use of DACs with the Raspberry Pi since I do not own one. I am quite happy with the quality of the analog output from the Raspberry Pi.

        1. Step 1. Download Step:
          Download and extract Win32DiskImager. This is available from multiple source including sourceforge.net. The tool is required for loading disk images to USB devices.
        2. Step 2. Download Step:
          Download the volumio distro from volumio.org/download. The page lists downloads RaspberryPi, Cubox, Udoo, Beaglebone Black and Compulab Utilite. Make sure you pick the download for the Raspberry Pi. This article is based on the distro released on 24-12-2013. The download is a 376MB zip file. Once downloaded, extract the disk image file from the zip archive. The uncompressed disk image size is 1.75GB.
        3. Load Image:
          Connect an empty (preferably formatted) SD card and launch Win32DiskImager. The tool should recognize the SD card upon launch. If you have more than one card connected ensure that the correct one is selected in the “Device” selection box. Point the “Image File” to the disk image file downloaded in step 2. Click on the ‘Write” button to start the process of loading the VolumIO image onto the SD card. The time taken to copy will depend on the speed of the SD card. It took 4 minutes to load the image onto my 4GB Sandisk Class 4 SD Card connected via a USB 2.0 capable card reader. Congratulations! You have successfully installed VolumIo on your SD Card.LoadVolumIOToSDCard
        4. Interlude:
          Volumio = Raspbian + Media Player Daemon (MPD) + samba web server + support for a large list of USB digital audio codecs (DACs) + folks obsessed with bit perfect audio reproduction.
          The good folks who built Volumio have trimmed out a lot of unnecessary stuff in the OS and tweaked a lot of the good stuff. The image does not have a GUI interface for the OS. Once installed, you will be able to use the Pi using the WebUI configured and ready to run on first boot. I control my Pi mostly from an Android phone using the built in browser. Though there are a couple of apps available for controlling the device, the default WebUI provides a superior experience.
        5. Connecting to the Pi:
          The following steps assume you are not connecting a monitor, keyboard and mouse to your Pi(headless mode). Plug in the SD card to the Pi and power up the device.
          Wired Ethernet:
          If you are using a wired Ethernet connection, you can connect to the device using SSH using the following details for the SSH connection:
          Host – volumio
          Username – volumio
          password – volumio
          You can also connect to the WebUI using the URL : http://volumio
          If for some reason you are unable to connect using the host name you can try using its IP address instead. On Microsoft Windows the command net view /all will list all computers connected on the LAN. The command nslookup host-name will list the ip address of the host name. If you do not see a computer named \\VOLUMIO, something is wrong with the setup. Check the management interface of your router to see if it has detected the device.
          Wireless Network
          Configuring the Pi to use a wireless network adapter is a little more tricky. You need to connect it at least once over the wired connection to configure the wireless network properties. Launch the WebUI of the Pi using its host-nmae or IP address as the URL from your browser. Click on the Menu link on the right side and navigate to Network and enter the properties of your wireless network. If you are the prefer the command line, edit /etc/network/interafces to have the following entries (for a wireless network using WPA security. If you are using WEP, switch to WPA. Its better!):

          auto lo
          iface lo inet loopback
          auto eth0
          iface eth0 inet dhcp
          auto wlan0
          allow-hotplug wlan0
          iface wlan0 inet dhcp
          wpa-ssid "your-wireless-network-ssid"
          wpa-psk "wireless-network-password"

          Replace your-wireless-network-ssid with the SSID of your network and wireless-network-password with the password. You can edit the file using the nano editor. (sudo nano /etc/network/interfaces).
          Unplug the Ethernet cable from the Pi and restart the device. You should now be able to connect to it via your wireless network.
        6. Configuring Samba:
          You have multiple options to host your music library. If your collection is relatively small ( a few GBs) you can transfer them directly to the SD card on which the volumio image is running. You can also transfer your music to an USB drive and attach it to the Pi. This option will lead to additional power being drawn from the device and hence you may need a powered USB hub to connect the USB devices instead of using the on-board USB ports. You can also attach a NAS disk to your network and stream your music from that disk. For all of these options, you need to configure the samba file server. Edit the samba.conf file located at /etc/samba to enable or disable the kind of shares you would like to use.  If you plan to use the SD card to hold your music collection, add the following entry to the smb.conf file:

          [SDCARD]
          comment = Musis stored on SD card
          path = /var/lib/mpd/music/sdcard
          read only = no
          public = yes
          follow symlinks = yes
          wide links = yes

          All the paths listed except WEBRADIO in the smb.conf file entries are actually symbolic links to other locations. An ls-l command lists the target of these links:

          ls -l /var/lib/mpd/music
          lrwxrwxrwx 1 root root 9 Jul 13 2013 NAS -> /mnt/NAS/
          lrwxrwxrwx 1 root root 8 Apr 8 20:58 RAMPLAY -> /run/shm
          lrwxrwxrwx 1 root root 20 Jun 29 07:52 sdcard -> /home/volumio/sdcard
          lrwxrwxrwx 1 root root 9 Apr 22 00:46 UPNP -> /mnt/UPNP
          lrwxrwxrwx 1 pi pi 8 Jul 30 2013 USB -> /mnt/USB
          drwxrwxrwx 2 pi pi 4096 Jun 27 09:47 WEBRADIO

          You can see that I have created a folder called sdcard in my home folder and created a softlink to it within /var/lib/mpd/music using the ln command:
          sudo mkdir /home/volumio/sdcard
          ln -s /home/volumio/sdcard /var/lib/mpd/music/sdcard
        7. Transfer music:
          You can now access your shares from any computer on the network using the IP address of the Pi. For example, if your IP address is 192.168.0.7, navigate to \\192.168.0.7 in Microsoft Windows and you see all the shares listed. You can now transfer the music files from your computer onto the device.
          You will need to update the MPD database every time you add new files to your collection. You can do this from the WebUI interface. Click on the Menu link at the right side and navigate to Library -> Update MPD database.
        8. Adding an internet radio station:
          The WebUI does not have an option to add a new internet radio station. Download the .pls file of the radio station and copy it to /var/lib/mpd/music/WEBRADIO. You need to do this via an SSH collection. Update the MPD database and you should now see the new station under the WebRadio section of your library.
          Thats it! You now have a working streaming audio player that you can control from any device connected to the same network. Once configured, this is the beautiful interface that you interact with:
          volumio
        9. System Administration
          You can accomplish many of the system management tasks (including restarting most of the services) using the WebUI. For more complex tasks, you always have access to the system via SSH. The Raspbian OS provides a nifty tool called raspi-config for making certain types of configuration changes. Launch it using sudo raspi-config and you see this nostalgic 80’s style GUI:
          raspi-config
          It is a good idea to run upgrade your system after initial setup using the following commands:
          sudo apt-get update
          sudo apt-get -y upgrade

          This will update components of the Rasbian OS even if you have picked up the latest release of volumio. The upgrade process can take a while to complete (it took 30 minutes on my 4 MBps broadband connection). If there is a question regarding the missing configuration file ‘/etc/php5/fpm/pool.d/www.conf’, choose the default option of retaining the current settings.
        10. Expanding the default partition on your SD card to use up the full capacity of the SD card:
          By default, the volumio image creates a 1.55GB EXT3 partition on your SD card for the OS. The rest of the space on your SD card is unallocated and is unusable. If you plan to use the SD card to store your music library, you need to jump through hoops to get the rest of the space usable. Using the “Expand Filesystem” option in raspi-config will not work for this image. You will get an error stating “your partition layout is not currently supported by this tool”.
          I have found that using the GParted utility is the easiest way to do this. If you are using Microsoft Windows, download the GParted Live CD and burn the image to a CD. There is also an option to create a bootable USB stick. You can find the downloads and instructions at http://gparted.org.  I tried the recommended method of using TuxBoot. It did not work for me. TuxBoot failed to load the image. I manually downloaded the 180MB image and created a bootable CD using the iso  file using CDBurnerXP. If you are planning on using a USB stick, you can follow the instructions posted at the gparted web site for a manual install.
          Remove the SD Card from the Pi and connect it to your computer and reboot your computer to boot into either the Gparted bootable CD or the bootable USB stick.  Once loaded, it will launch the partition utility automatically. By default, the utility will list the hard drive on your system. Remember to pick the SD card from the drop down on the right hand corner as shown in the screen grab below:
          gparted-select sdcard (Small)
          In the example above, I have used a 4GB SD card to load the volumio image. You can see that only 1.55GB has been allocated.  Select the allocated 1.55 GB partition and use the resize button to resize the partition to fill up the available disk space. You can ignore the 75MB FAT32 partition created on the SD card. This is created by SD card manufacturers.
          gparted-resize (Small)Click on the apply button to commit the changes. The resize operation can take a few seconds to a few minutes to complete depending on the size and speed of your card:
          gparted-resize progress (Small)
          Shutdown the computer once the operation completes and re-insert your card into the Pi and fire it up. You can now transfer your music collection to the SD card from your PC. On Microsoft Windows click on Start and type \\volumio in the search box. An explorer window should open showing all your samba shares. You should see SDCARD listed among the shares. Any files you transfer into this will go into the target of the symbolic link you created for /var/lib/mpd/music/sdcard.
        11. Backup your image
          Once you have configured your Pi to, it is advisable to create a backup of your image. This will save you a lot of time if your image gets corrupt (happens with the Pi). Remove the SD card from the device and connect it to your PC. Use the Win32DiskImager tool to create a backup. Use the read option to create an image from the SD card.

The Design of Everyday Interfaces – 06 – On Graphical Integrity

This post is inspired by an example from the book “The Visual Display of Quantitative Information” by Edward Tufte. This book is a fascinating read for anyone interested in graphs and plots that convey statistically meaningful data. The works of Edward Tufte’s fill an essential void in literature given that almost everyone these days has the need to understand graphical displays of information.  Some books are meant to be read while some are meant to held, caressed and respected at the same time. This book falls under the latter category. The author is personally involved with the final layout and the print of his books and this is evident when you lay your hands on the book.

In the first section of the book, the author provides stunning examples of graphical displays spanning many centuries. The graphics showing the march of Napoleon into Russia and the train route timings between Paris and Lyon are alone is worth the price of this book. The author then talks of the importance of (laments about the lack thereof actually) graphical integrity – creating graphical displays where the visual representation of data reflects the actual effect of the data in numbers. He then shows numerous examples of real displays that have sought to “play” around with the visual display to mask the true meaning of the underlying data. One example in particular impressed me lot, primarily because I see such graphs often and it took me quite a while to figure out the guile in the display. I do not want to reproduce the same example from the book as I am not sure of the copyright held by the author for that particular example. I am phrasing it in my own words here.

If I were to tell you that the following bar graph displays the net profit of a company for the past five years(2009-2013), what would be your conclusion regarding the first two years (bars 1 and 2) on the plot?

Bar Graph -1Based on the display alone, the viewer’s perception would be the following:

  1. The company made a profit in 2009
  2. The profit in 2010 was more than the profit in 2009 (by around 15-20%).

The actual data represented by the graph above is this:

Year Net profit in INR
2009 -20000
2010 100000
2011 150000
2012 130000
2013 160000

Notice that the company actually made a loss in 2009!!! The true representation of the data is this:

Bar Graph -2

How then are the following two graphs identical in terms of the underlying data?

Bar Graph -3The ingenuity (I call it deceit) lies in the choice of the origin for the x-axis in the plot. Notice that in the truthful one (the green plot), the origin is at zero like it normally is.  The visual deceit of the orange plot is achieved by the moving the origin to a large negative value (-400000 in this case). Eliminating the labels for the y-axis (as shown in the first plot in this post) while adding the data labels for each bar completes the deceit.  If you use Microsoft Excel, go ahead and try this out.  Create a set of data values and create a bar graph based on this data. You will get the green plot by default. Double click anywhere within the labels area on the Y-axis and you will get the following dialog:

Excel OptionsNotice the changes I have made that are circled in red.  I have modified the default values of these fields to -400,000. I am providing this example to help you understand how graphs can be used to mislead the viewer. I do not endorse any form of trickery however docile they may be. 

The author then goes on to elaborate other techniques that are commonly used to violate graphical integrity. That is perhaps the subject for another post.

Do let me know if you encounter such displays. You can upload them on photo sharing sites such as imgur.com and share a link in the comment. Please be cognizant of copyright and privacy issues when you post such content. 

How to compress DSLR videos to a manageable size

A lot has been written and spoken about the movie making capabilities of the current generation of digital SLR cameras that were originally designed for still photography.  Though the capability has existed for a long time now, it was in the commercial interests of camera makers to “segment” the market into customers who wanted to shoot still images and customer’s who wanted to shoot video. These manufacturers have now been forced to merge their market segments thanks largely due to the growing base of customers who do want both in the same device. There is in fact a growing aversion among enthusiast customers to buy a a camcorder largely due to two reasons: One is the availability of decent video capabilities on higher end smartphones (which cost the same as a good camcorder anyway). Second is the realization that the it is not convenient to lug around a bundle of special purpose devices and switch between them when a single device that can do the same job albeit with lesser features is available in the market.  If you are in the market looking for a device that can do ‘prosumer’ grade photography while also allowing you to take high quality video, you should consider the new (now old) kid on the block – Mirror-less or micro four thirds cameras. The naming is reflective of the disdain camera manufactures have had for the uneducated customer! Neither the term mirror-less nor the term micro four thirds makes any sense unless you know the internal construction of a camera. Naming aside, what’s important to know is that all camera manufactures have one or more models in this category. It is also interesting that Canon is literally a non player in the category considering the lukewarm response to their EOS-M cameras.

After having read tons of online ‘literature’ and talking to a couple of my friends who are professional photographers, I ended up buying a Canon EOS 700D DSLR camera along with a poor man’s kit of a 50mm prime lens and an external flash. The flash alone cost me more than the point and shoot camera  that I had owned and loved for the previous 7 years. The jump in quality from my Canon point and shoot (powershot A630) was significant considering that I had taken the following pictures using my point and shoot camera in 2007:

IMG_2798 IMG_3489


The improvement in quality was far more significant for videos. While the point and shoot had video capabilities, I had stopped using it after an initial trial because the quality and size of the video was very poor. The DSLR on the other hand can record high definition video at 1080p. Experience with the DSLR taught me the one great advantage and three drawbacks with DSLR video:

The BIG advantage:

Even an entry level DSLR can beat the socks out or a “prosumer” camcorder for videos shot in low light conditions. Given how cameras treat light, you can be reasonably assured to be in low light conditions unless you are shooting outdoors. My primary purpose was to shoot videos of my baby indoors. The quality of footage can be controlled by a dizzying array of interchangeable lenses. This is something you cannot do with a camcorder.  This advantage alone dwarfs the disadvantages below.

The three disadvantages:

  1. The size of video files are abnormally large. A 30 second clip is around 170 MB (mega bytes) in size! This translates to a regular 90 minute movie size being 15 GB!
  2. It is difficult to keep a moving subject in continuous focus. This is getting fixed in the newer models.
  3. You have limit your recordings to short clips of around 12 minutes each. The heat buildup on the sensor on the cameras is the reason for this limitation.

Of the 3 limitations above, it is possible to address the huge file size issue once you have transferred your videos to your computer. This is not such an attractive option for people who would like to upload their videos directly to media sharing websites such as YouTube.  After trying out many options (including Adobe Premierie, VirtualDub etc), I have concluded on the following workflow. This workflow is ideally suited if you are not planning to make a lot of edits to your video. My aim is to achieve two things:

  1. Shrink the size of the video while maintaining as much of the quality as possible. My rule of thumb – if I cannot make out the difference in quality in the compressed video, it is OK.  People don’t mind minor reduction in video resolution if the content is interesting. This is one of the reasons why Youtube is more popular than Vimeo though Vimeo allows higher resolution uploads(edit: YouTube has added support for high resolution videos now). There is no fun is waiting for a high resolution video to stream into your box.
  2. Merge clips without having to lose quality just because of the merge (I don’t want to re-render just for the sake of merging).

I was pleasantly surprised to discover that I can do both of the above with the tiniest bit of software possible for such a task.  This is my workflow for compressing DSLR videos:

The Setup:

  1.  Download MPEG StreamClip from http://www.squared5.com/.This is a 800 KB file that can be run as-is. No installation is required.
  2. Download and install Quick Time alternative version 1.81. This is required only if you do not have Apple Quick time installed on your system.  You can download quick time alternative from http://filehippo.com/download_quicktime_alternative/2615.  The installer is a 13 MB download.

Using MPEG StremClip:

  1. The MPEG Stream clip interface is simple though they could have had two versions of of the UI – one with with the mumbo jumbo known only to video editing professionals and one for the rest of the planet.  As it stands, you need to understand a few terms to get the tool to do what you want.
  2. Open the clip that you want to compress using the Open Files option on the file menu. Once the file is opened, navigate to the “Export to MPEG-4” option on the file menu. This will open up the following dialog window:
  3.  MPeg StreamClip
  4. If you are planning to transfer the final output to any Apple device, click on the iTunes button, choose the device and you are done! Simply click the Make MP4 button and your compressed video is ready. If you want to control the settings, proceed to step 5.
  5. Compression technique : You have three options for the compression technique. I prefer the H.264 compressor. H.264 is a compression standard that is incredibly popular and is hence guaranteed to work on the largest number of devices. If you don’t know what H.264 is don’t bother. Just use it!
  6. Compression Quality : This is the slider below the compression technique selection box. The default is 50%.  Change it to 100%. We are compressing anyway. Lets do a good job of that!
  7. Limit Data Rate : This is the only option you need to understand if your main aim is reduction in file size. This option is essentially asking you how much space should one second of video consume in your output. Video compression is not linear (all seconds are not the same!) and hence it is a average value. The tool has a neat feature of providing an estimate of the compressed file based on the data rate you choose. My choice is based on the size of regular DVD movie discs. I would like to compress 90 minutes of video into about 2 GB. This translates to a bit rate of 0.3 MBps (note the upper case B).  You can see in the screen grab above that this translates to about 10 MB for a 30 second clip.
  8. Sound : Choose MPEG-4, stereo 128 Kbps. You can safely drop the bit rate of the audio without fear of losing quality though the gains would not be significant. Remember most internet radio stations broadcast at 128 KBps or lesser.  I listen to a radio station regularly that broadcasts at 28 Kbps!
  9. Frame Size : I leave this option as-is. The tool detects the frame size of the input file and selects that by default. Frame size is the physical dimension (in pixels) of the output video.
  10. The other options: All other options are best left untouched. You need to change the frame rate only if you want to convert a 60/120 fps clip to render at 30 fps to give the slow motion effect. Frame blending should not be needed unless you change the frame rate. De-Interlace video should not be needed for DSLR videos.  I have tried mutl-pass rendering and I could not really observe a big difference for the clips I tried it on.
  11. That’t it! Go ahead and press the Make MP4 button and wait for the video to render. This can take a while depending on the size of your video. A 30 second clip takes a couple of minutes t render on an old Intel Centrino based system. Video rendering speeds are dependent on the processing power you have.
  12. Compare the output video with the original. If you are happy with the quality of the output, you can save the setting as a preset.  Launch the export dialog again, choose the same settings and press the presets button to save your settings as a preset. You don’t have to do this every time once you have a preset.
  13. If you want to combine multiple clips, open all of them (notice the option is labelled Open Files and not open file) and follow the same steps as above.

Do let me know via comments if this works for you.  MPEG StreamClip is one of the most under-rated tools for simple video editing tasks – much like how Microsoft treated OneNote for the first few years after its launch.


The Design of Everyday Interfaces – 5 (A humorous signifier)

Part 5 of the series on the design of everyday interfaces.

This is a signpost that I saw at the Indian Institute of Science, Bangalore. The signpost purpose is to convey a message – Go Slow.    At first glace, I assumed that someone had erased the digit to the left of the zero. On close examination, I was not so sure. Maybe someone wanted to be very clear with the message…

19082012259


I am posting this symbol for its ability to bring a smile to your face.  This is not reflective of the campus. The campus is one of the best in the country and ranked among the top  500 universities in the world.

Older articles in series:

Part 4 Part 3   Part 2   Part 1

The Design of Everyday Interfaces – 4 (The Wacom Preferences Utility)

Part 4 of the series on the design of everyday interfaces.

The following is a screen grab of the utility that is provided with the Wacom Bamboo (now called One By Wacom in India) pen tablet. The purpose (affordance) of the utility is to allow users to configure the behavior of the Wacom pen. What I found to be particularly confusing is the configuration of the action that should be triggered when I press one of the ends of the button on the pen.  This is a case of a missing or incomplete signifier. The purpose of the Sounds option on the right is also not clear. There is ample free space in the UI that could have been used by the designer to provide information on what the controls on the UI do.

Wacom Preferences Tool

At the very least, I would prefer the following modified (Photoshop’ed) UI:

Wacom Preferences A - Modified

Older articles in series:

Part 3   Part 2   Part 1

The Design of Everyday Interfaces – 3 (The confusing system image at Udacity)

Part 3 of the series on the design of everyday interfaces.

We all build conceptual models of the world around us. John Medina explains in his very entertaining book that the brain processes information visually though the input may not necessarily be visual. For example, the visual model of a classroom will contain the image of the teacher writing on a black(white nowadays) board.  In this image, the hand that writes will be on top of the content that is being written. This is so fundamental that it is difficult to even thin otherwise. That is until you watch any video on a Udacity course where the instructor is annotating a slide on screen. The following is a screen grab of one such instance (taken from the course – The Design of Everyday Things):

Udacity - A

Do you notice something strange? The hand is behind the content! This is weird and it actually makes it difficult for me to concentrate on the content. My mind is stuck with this counter-intuitive way of writing on a board.  I cannot think of a good reason for this design. Maybe the designer had a conceptual model for live annotations that is not apparent in the system image. To know more about the difference between a conceptual model and a system image, read this article by Donald Norman. Search for the text “Conceptual Models & User-Centered Design” in the article.

Can you think of a reason for the strange design of the annotation feature of a Udacity course video? Please post it as a comment to this post.

Older articles in series:

Part 2   Part 1